
Market Study & Thesis
Junto finds deals that are not on the market — buildings mired in legal, operational, or personal problems. Unlocking them requires integrated expertise in legal, construction, and brokerage, deployed as a single team.
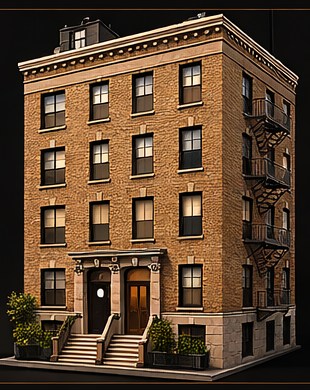
Worst Building Best Block
Acquire distressed small multifamily in prime neighborhoods. Gut renovate to boutique product. Exit into a market that cannot source what we manufacture.
Target Profile
- Pre-war walk-ups and mixed-use, 6–40 units, typically 25–50 ft frontage
- 100% free-market or deliverable vacant — no rent-stabilized exposure
- Owned by families, estates, or motivated sellers — not institutions
Value Creation
- Full gut renovation to institutional-grade finishes
- Floor plate reconfiguration — railroad layouts to true 2BR/3BR with in-unit W/D and HVAC
- DOB/HPD violation clearance
- Retail lease repositioning on mixed-use acquisitions
Guarantor Scoring
A 1–5 index measuring safety, transit density, parent comfort (cleanliness, reputation, streetscape), and 20-something lifestyle (bars, restaurants, walkability). The highest-scoring neighborhoods satisfy both the guarantor and the tenant.
Six Building Archetypes
Three primary types, one boutique, one expansion, one exclusion.

| Class | C4 Old Law |
| Built | 1879–1901 |
| Height | 5–6 Stories |
| Lot | 25×100 ft |
| Units | 15–24 |
| Inventory | ~10,000 Manhattan |
| Entry Basis | $275–325/SF |
| Typical Acq. | $4.0–6.2M |
| Gut Budget | $200–275/SF |
| All-In Basis | $475–600/SF |
| Resale Comp | $700–900+/SF |
| Target IRR | 15–25% |
ROC
Equity Multiple
Yr3 IRR
Equity Check

| Class | C2/C4 New Law |
| Built | 1901–1929 |
| Height | 6–7 Stories |
| Lot | 30–50 ft |
| Units | 20–40 |
| Inventory | ~4,000 Manhattan |
| Entry Basis | $250–375/SF |
| Typical Acq. | $5.5–9.0M |
| Gut Budget | $225–300/SF |
| All-In Basis | $475–675/SF |
| Resale Comp | $750–1,000+/SF |
| Target IRR | 15–25% |
ROC
Equity Multiple
Yr3 IRR
Equity Check

| Class | C7 Mixed-Use |
| Built | 1900–1935 |
| Height | 4–6 Stories |
| Lot | 25 ft |
| Units | 8–20 + Retail |
| Inventory | ~3,500 Manhattan |
| Entry Basis | $225–325/SF |
| Typical Acq. | $3.0–5.5M |
| Gut Budget | $175–250/SF |
| All-In Basis | $400–575/SF |
| Resale Comp | $650–850/SF |
| Target IRR | 18–28% |
ROC
Equity Multiple
Yr3 IRR
Equity Check

| Class | C3 Brownstone |
| Built | 1840–1900 |
| Height | 4–5 Stories |
| Lot | 20 ft |
| Units | 4–8 |
| Inventory | ~2,000 Manhattan |
| Entry Basis | $300–425/SF |
| Typical Acq. | $2.5–4.5M |
| Gut Budget | $250–350/SF |
| All-In Basis | $550–775/SF |
| Resale Comp | $900–1,200+/SF |
| Target IRR | 15–22% |
| Class | C1/C0 Small Apt |
| Built | 1910–1940 |
| Height | 3–6 Stories |
| Lot | 25–40 ft |
| Units | 6–20 |
| Inventory | ~6,000 QN/BK |
| Entry Basis | $150–225/SF |
| Typical Acq. | $1.5–3.5M |
| Gut Budget | $150–225/SF |
| All-In Basis | $300–450/SF |
| Resale Comp | $500–650/SF |
| Target IRR | 20–30% |
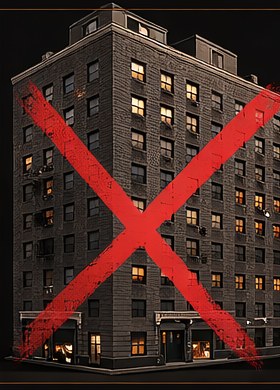
| Class | C2/C8 |
| Built | 1910–1935 |
| Height | 7–10 Stories |
| Lot | 40–60 ft |
| Units | 30–60 |
| Inventory | ~3,200 Manhattan |
| EXCLUDED FROM MANDATE | |
| Elevator, boiler, and riser replacement eliminates value-add spread. Institutional ownership competition. Cap-ex risk exceeds return profile. |
Addressable inventory across approved neighborhoods: 5,500–7,000 buildings. Annual trading volume: 150–250. At four acquisitions per year, the fund requires less than 2% of annual flow.
Target Geography
Inventory from NYC PLUTO. Rent/SF annualized from median 1BR (RentHop, Mar 2026). Est. Available based on ~2–3% annual turnover of eligible free-market stock.
| Neighborhood | PA | Archetype | Bldgs | Est. Avail | Rent/SF |
|---|---|---|---|---|---|
| West Village | 5.0 | C7 mixed-use / C6 walk-up | 500–900 | 10–15 | $111 |
| Brooklyn Heights | 5.0 | C6 walk-up / brownstone | 250–450 | 5–8 | $94 |
| Upper West Side | 5.0 | C5 converted / C6 walk-up | 900–1,300 | 15–20 | $104 |
| Greenwich Village | 4.5 | C7 mixed-use / C4 Old Law | 500–900 | 10–15 | $111 |
| Cobble Hill / Carroll Gdns | 4.5 | C3 brownstone / C2 walk-up | 700–1,100 | 10–15 | $81 |
| UES / Yorkville | 4.5 | C7 mixed-use / C4 Old Law | 900–1,400 | 15–25 | $98 |
| Park Slope | 4.5 | C1 walk-up / C6 co-op | 1,200–2,000 | 15–25 | $67 |
| Neighborhood | PA | Archetype | Bldgs | Est. Avail | Rent/SF |
|---|---|---|---|---|---|
| Chelsea | 4.0 | C4 Old Law / C6 walk-up | 600–900 | 10–15 | $127 |
| Gramercy / Kips Bay | 4.0 | Small prewar apt / boutique | 150–300 | 3–6 | $111 |
| Boerum Hill | 4.0 | C3 brownstone / boutique | 400–700 | 6–10 | $92 |
| Vernon-Jackson / LIC | 4.0 | Small apt house / mixed-use | 150–300 | 3–5 | $88 |
| Prospect Heights | 3.5 | Brownstone / small walk-up | 450–750 | 6–10 | $73 |
| Astoria | 3.5 | C0/C1/C2 Queens low-rise | 1,500–2,500 | 20–35 | $63 |
| Neighborhood | PA | Archetype | Bldgs | Est. Avail | Rent/SF |
|---|---|---|---|---|---|
| East Village | 3.0 | C4 Old Law / C7 mixed-use | 800–1,200 | 12–18 | $83 |
| Hell’s Kitchen | 3.0 | C4 Old Law / older walk-up | 700–1,000 | 10–15 | $88 |
| Lower East Side | 2.5 | C4 Old Law / C7 mixed-use | 500–800 | 8–12 | $90 |
| Hamilton Heights | 2.0 | C5 converted / older low-rise | 600–900 | 10–15 | $60 |
| East Harlem (<125th) | 1.5 | Older walk-up / mixed-use | 900–1,400 | 15–20 | $71 |
Non-Negotiable Boundaries
- Rent-stabilized buildings (>10% of units). HSTPA 2019 eliminated vacancy deregulation.
- Elevator buildings (>7 stories, >60 units). Mechanical cap-ex destroys the spread.
- Luxury condos, loft districts (SoHo, Tribeca). Already repositioned. No value-add entry.
- Fringe locations. The thesis requires prestige-neighborhood scarcity at exit.
Market Study Workstreams
Why Now
The Operator's Edge
- Regulatory arbitrage. Free-market buildings accounted for 84% of Manhattan multifamily dollar volume in 2025.
- Manufactured institutional product. Permanent deficit of pristine boutique buildings that institutional capital wants but cannot create.
- Irreplaceable supply. Historic district protections make new comparable construction impossible.
- Timing. Cap rates corrected 100+ bps from 2021 lows. Manhattan rental vacancy at 2.3%.